Direct Line 650.455.4545     Email OrlandoGuillory@gmail.com     License: Cal BRE# 01912949
Orlando Guillory

Orlando Guillory

Integrity, Knowledge and Commitment...for Superior Results!

South San Francisco

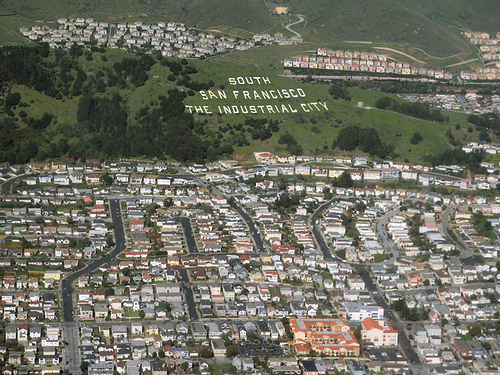
The home of San Francisco International Airport, the city of South San Francisco, is often credited as the birthplace of the biotechnology industry. Since the 1970s when Genentech became the first company to commercially apply recombinant DNA technology, the industry has grown in South San Francisco as steadily and intensely as any location in the world. In the face of this growth and expansion, the economic base has diversified to encompass a wide spectrum of related businesses and supportive scientific enterprises.

The city’s coastal location and attractive housing options have enhanced residential growth as well, drawing newcomers to the balmy climate, lush parks, and easy access to the San Francisco Bay for premier marinas, water sports, and boating activities. 3Com Park and professional sports thrills are just 10 minutes from home, while the bright lights and world-class amenities of San Francisco are only 15 minutes away. Those who desire all the cosmopolitan advantages of San Francisco within the context of a less hectic pace may find South San Francisco to be the ideal residential choice.

Avalon Park Etc. (30-day trend)
 
Number of Properties
Avg Price
Avg $/SQFT
Avg DOM
% of Avg Sold Price/Avg List Price
Active
0 (Number of Properties)
$0 (Avg Price)
$0 (Avg $/SQFT)
0 (Avg DOM)
Sold
1 (Number of Properties)
$1,300,000 (Avg Price)
$902 (Avg $/SQFT)
40 (Avg DOM)
113% (% of Avg Sold Price/Avg List Price)
Brentwood (30-day trend)
 
Number of Properties
Avg Price
Avg $/SQFT
Avg DOM
% of Avg Sold Price/Avg List Price
Active
0 (Number of Properties)
$0 (Avg Price)
$0 (Avg $/SQFT)
0 (Avg DOM)
Sold
0 (Number of Properties)
$0 (Avg Price)
$0 (Avg $/SQFT)
0 (Avg DOM)
0% (% of Avg Sold Price/Avg List Price)
Buri-Buri / Country Club (30-day trend)
 
Number of Properties
Avg Price
Avg $/SQFT
Avg DOM
% of Avg Sold Price/Avg List Price
Active
1 (Number of Properties)
$1,151,521 (Avg Price)
$911 (Avg $/SQFT)
25 (Avg DOM)
Sold
2 (Number of Properties)
$1,555,000 (Avg Price)
$1,021 (Avg $/SQFT)
22 (Avg DOM)
114% (% of Avg Sold Price/Avg List Price)
Diamond Heights / Pecks Lots (30-day trend)
 
Number of Properties
Avg Price
Avg $/SQFT
Avg DOM
% of Avg Sold Price/Avg List Price
Active
1 (Number of Properties)
$1,028,684 (Avg Price)
$676 (Avg $/SQFT)
142 (Avg DOM)
Sold
0 (Number of Properties)
$1,425,000 (Avg Price)
$507 (Avg $/SQFT)
94 (Avg DOM)
96% (% of Avg Sold Price/Avg List Price)
Mayfair Village (30-day trend)
 
Number of Properties
Avg Price
Avg $/SQFT
Avg DOM
% of Avg Sold Price/Avg List Price
Active
0 (Number of Properties)
$1,288,888 (Avg Price)
$1,145 (Avg $/SQFT)
14 (Avg DOM)
Sold
2 (Number of Properties)
$1,269,000 (Avg Price)
$934 (Avg $/SQFT)
36 (Avg DOM)
101% (% of Avg Sold Price/Avg List Price)
Old South SF / Rocca (30-day trend)
 
Number of Properties
Avg Price
Avg $/SQFT
Avg DOM
% of Avg Sold Price/Avg List Price
Active
3 (Number of Properties)
$1,341,343 (Avg Price)
$823 (Avg $/SQFT)
75 (Avg DOM)
Sold
0 (Number of Properties)
$932,812 (Avg Price)
$630 (Avg $/SQFT)
36 (Avg DOM)
99% (% of Avg Sold Price/Avg List Price)
Parkway (30-day trend)
 
Number of Properties
Avg Price
Avg $/SQFT
Avg DOM
% of Avg Sold Price/Avg List Price
Active
0 (Number of Properties)
Serra Highlands (30-day trend)
 
Number of Properties
Avg Price
Avg $/SQFT
Avg DOM
% of Avg Sold Price/Avg List Price
Active
0 (Number of Properties)
$1,210,000 (Avg Price)
$1,080 (Avg $/SQFT)
2 (Avg DOM)
Sold
0 (Number of Properties)
$0 (Avg Price)
$0 (Avg $/SQFT)
0 (Avg DOM)
0% (% of Avg Sold Price/Avg List Price)
So. San Francisco - Industrial (30-day trend)
 
Number of Properties
Avg Price
Avg $/SQFT
Avg DOM
% of Avg Sold Price/Avg List Price
Active
0 (Number of Properties)
$1,098,000 (Avg Price)
$1,045 (Avg $/SQFT)
7 (Avg DOM)
Sold
1 (Number of Properties)
$1,300,000 (Avg Price)
$1,238 (Avg $/SQFT)
29 (Avg DOM)
118% (% of Avg Sold Price/Avg List Price)
Southwood (30-day trend)
 
Number of Properties
Avg Price
Avg $/SQFT
Avg DOM
% of Avg Sold Price/Avg List Price
Active
0 (Number of Properties)
$0 (Avg Price)
$0 (Avg $/SQFT)
0 (Avg DOM)
Sold
1 (Number of Properties)
$1,449,076 (Avg Price)
$867 (Avg $/SQFT)
31 (Avg DOM)
109% (% of Avg Sold Price/Avg List Price)
Sterling Terrace / Stonegate (30-day trend)
 
Number of Properties
Avg Price
Avg $/SQFT
Avg DOM
% of Avg Sold Price/Avg List Price
Active
2 (Number of Properties)
$1,341,048 (Avg Price)
$898 (Avg $/SQFT)
4 (Avg DOM)
Sold
3 (Number of Properties)
$881,922 (Avg Price)
$708 (Avg $/SQFT)
73 (Avg DOM)
100% (% of Avg Sold Price/Avg List Price)
Sunshine Gardens (30-day trend)
 
Number of Properties
Avg Price
Avg $/SQFT
Avg DOM
% of Avg Sold Price/Avg List Price
Active
2 (Number of Properties)
$545,571 (Avg Price)
$700 (Avg $/SQFT)
9 (Avg DOM)
Sold
3 (Number of Properties)
$1,352,473 (Avg Price)
$1,017 (Avg $/SQFT)
39 (Avg DOM)
114% (% of Avg Sold Price/Avg List Price)
Westborough (30-day trend)
 
Number of Properties
Avg Price
Avg $/SQFT
Avg DOM
% of Avg Sold Price/Avg List Price
Active
3 (Number of Properties)
$810,974 (Avg Price)
$715 (Avg $/SQFT)
41 (Avg DOM)
Sold
5 (Number of Properties)
$1,000,666 (Avg Price)
$646 (Avg $/SQFT)
86 (Avg DOM)
102% (% of Avg Sold Price/Avg List Price)
Winston Manor (30-day trend)
 
Number of Properties
Avg Price
Avg $/SQFT
Avg DOM
% of Avg Sold Price/Avg List Price
Active
0 (Number of Properties)
$1,828,000 (Avg Price)
$692 (Avg $/SQFT)
4 (Avg DOM)
Sold
1 (Number of Properties)
$1,275,000 (Avg Price)
$958 (Avg $/SQFT)
22 (Avg DOM)
110% (% of Avg Sold Price/Avg List Price)

Property Info