Direct Line 650.455.4545     Email OrlandoGuillory@gmail.com     License: Cal BRE# 01912949
Orlando Guillory

Orlando Guillory

Integrity, Knowledge and Commitment...for Superior Results!

Daly City
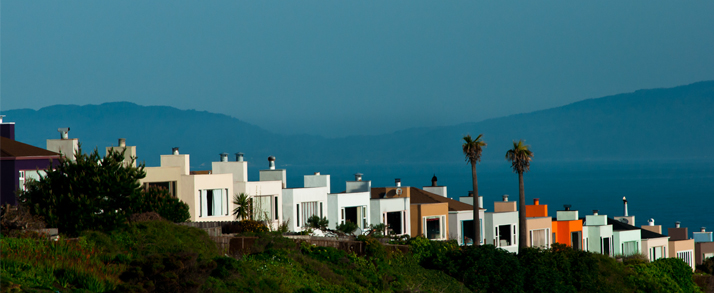
A green-belt community of beautiful historic cemeteries and agricultural gardens, the unique town of Colma encircles a thriving regionally oriented commercial area. The abundance of cemeteries dates back to the turn of the century, when San Francisco’s land scarcity prompted the city to look elsewhere for interments — namely, San Mateo County. Over the decades, businesses and residential developments emerged to form a charming community and modern city infrastructure nestled in the gently rolling hills of the Peninsula.

Newcomers will find in Colma a pleasing combination of small-town amenities and services, including restaurants, one of Northern California’s largest auto dealerships, shopping districts, a movie theater, and a first-rate outlet center filled with discounted name-brand merchandise. The expanded amenities in neighboring Daly City make life in this intimate community even more convenient and appealing. The two communities even share a chamber of commerce.

'Original' Daly City (30-day trend)
 
Number of Properties
Avg Price
Avg $/SQFT
Avg DOM
% of Avg Sold Price/Avg List Price
Active
6 (Number of Properties)
$1,092,489 (Avg Price)
$628 (Avg $/SQFT)
46 (Avg DOM)
Sold
7 (Number of Properties)
$862,452 (Avg Price)
$695 (Avg $/SQFT)
59 (Avg DOM)
101% (% of Avg Sold Price/Avg List Price)
St. Francis Heights (30-day trend)
 
Number of Properties
Avg Price
Avg $/SQFT
Avg DOM
% of Avg Sold Price/Avg List Price
Active
1 (Number of Properties)
$1,499,000 (Avg Price)
$569 (Avg $/SQFT)
55 (Avg DOM)
Sold
1 (Number of Properties)
$1,309,090 (Avg Price)
$1,036 (Avg $/SQFT)
35 (Avg DOM)
109% (% of Avg Sold Price/Avg List Price)
Westlake Highlands (30-day trend)
 
Number of Properties
Avg Price
Avg $/SQFT
Avg DOM
% of Avg Sold Price/Avg List Price
Active
1 (Number of Properties)
$1,145,657 (Avg Price)
$826 (Avg $/SQFT)
18 (Avg DOM)
Sold
0 (Number of Properties)
$1,327,272 (Avg Price)
$913 (Avg $/SQFT)
29 (Avg DOM)
124% (% of Avg Sold Price/Avg List Price)
Westlake Knolls (30-day trend)
 
Number of Properties
Avg Price
Avg $/SQFT
Avg DOM
% of Avg Sold Price/Avg List Price
Active
0 (Number of Properties)
Broadmoor (30-day trend)
 
Number of Properties
Avg Price
Avg $/SQFT
Avg DOM
% of Avg Sold Price/Avg List Price
Active
1 (Number of Properties)
$949,999 (Avg Price)
$959 (Avg $/SQFT)
1 (Avg DOM)
Sold
0 (Number of Properties)
$0 (Avg Price)
$0 (Avg $/SQFT)
0 (Avg DOM)
0% (% of Avg Sold Price/Avg List Price)
Southern Hills (30-day trend)
 
Number of Properties
Avg Price
Avg $/SQFT
Avg DOM
% of Avg Sold Price/Avg List Price
Active
1 (Number of Properties)
$952,759 (Avg Price)
$745 (Avg $/SQFT)
37 (Avg DOM)
Sold
2 (Number of Properties)
$1,067,016 (Avg Price)
$769 (Avg $/SQFT)
32 (Avg DOM)
104% (% of Avg Sold Price/Avg List Price)
Westlake Heights (30-day trend)
 
Number of Properties
Avg Price
Avg $/SQFT
Avg DOM
% of Avg Sold Price/Avg List Price
Active
0 (Number of Properties)
$0 (Avg Price)
$0 (Avg $/SQFT)
0 (Avg DOM)
Sold
1 (Number of Properties)
$1,228,469 (Avg Price)
$1,168 (Avg $/SQFT)
44 (Avg DOM)
113% (% of Avg Sold Price/Avg List Price)
Westlake Palisades (30-day trend)
 
Number of Properties
Avg Price
Avg $/SQFT
Avg DOM
% of Avg Sold Price/Avg List Price
Active
0 (Number of Properties)
$0 (Avg Price)
$0 (Avg $/SQFT)
0 (Avg DOM)
Sold
0 (Number of Properties)
$1,296,808 (Avg Price)
$1,108 (Avg $/SQFT)
29 (Avg DOM)
117% (% of Avg Sold Price/Avg List Price)
Westlake Terrace (30-day trend)
 
Number of Properties
Avg Price
Avg $/SQFT
Avg DOM
% of Avg Sold Price/Avg List Price
Active
1 (Number of Properties)
$1,061,470 (Avg Price)
$891 (Avg $/SQFT)
99 (Avg DOM)
Sold
0 (Number of Properties)
$0 (Avg Price)
$0 (Avg $/SQFT)
0 (Avg DOM)
0% (% of Avg Sold Price/Avg List Price)
Blossom Valley (30-day trend)
 
Number of Properties
Avg Price
Avg $/SQFT
Avg DOM
% of Avg Sold Price/Avg List Price
Active
0 (Number of Properties)
$714,414 (Avg Price)
$733 (Avg $/SQFT)
28 (Avg DOM)
Sold
0 (Number of Properties)
$1,250,000 (Avg Price)
$880 (Avg $/SQFT)
35 (Avg DOM)
104% (% of Avg Sold Price/Avg List Price)
Crown Colony (30-day trend)
 
Number of Properties
Avg Price
Avg $/SQFT
Avg DOM
% of Avg Sold Price/Avg List Price
Active
6 (Number of Properties)
$561,479 (Avg Price)
$696 (Avg $/SQFT)
18 (Avg DOM)
Sold
2 (Number of Properties)
$720,000 (Avg Price)
$618 (Avg $/SQFT)
44 (Avg DOM)
98% (% of Avg Sold Price/Avg List Price)
Serramonte (30-day trend)
 
Number of Properties
Avg Price
Avg $/SQFT
Avg DOM
% of Avg Sold Price/Avg List Price
Active
5 (Number of Properties)
$972,787 (Avg Price)
$680 (Avg $/SQFT)
32 (Avg DOM)
Sold
2 (Number of Properties)
$1,174,564 (Avg Price)
$790 (Avg $/SQFT)
34 (Avg DOM)
106% (% of Avg Sold Price/Avg List Price)
Westlake #1 & Olympic (30-day trend)
 
Number of Properties
Avg Price
Avg $/SQFT
Avg DOM
% of Avg Sold Price/Avg List Price
Active
0 (Number of Properties)
$0 (Avg Price)
$0 (Avg $/SQFT)
0 (Avg DOM)
Sold
1 (Number of Properties)
$1,612,878 (Avg Price)
$986 (Avg $/SQFT)
40 (Avg DOM)
118% (% of Avg Sold Price/Avg List Price)

Property Info