Direct Line 650.455.4545     Email OrlandoGuillory@gmail.com     License: Cal BRE# 01912949
Orlando Guillory

Orlando Guillory

Integrity, Knowledge and Commitment...for Superior Results!

San Bruno
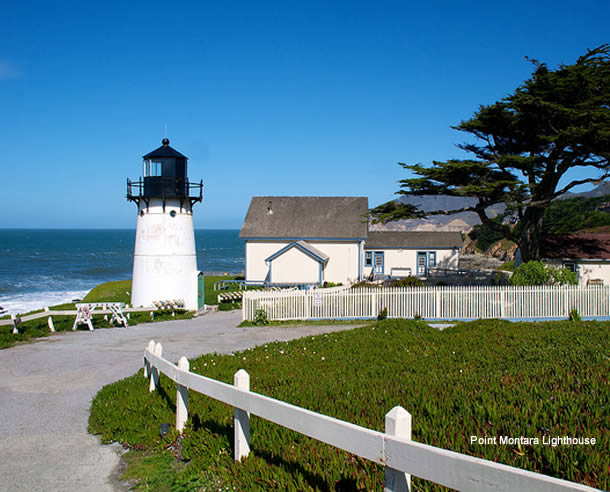
Culturally diverse, the City of San Bruno is ideally located just 12 miles south of San Francisco and immediately adjacent to San Francisco International Airport. Situated along Highway 101 and Interstate 280, the community offers its residents easy access to the superb cultural, educational, and recreational opportunities in the Bay Area. The city has managed to preserve its friendly, small-town atmosphere in close proximity to one of the world’s leading metropolitan centers. 

San Bruno highlights include thriving companies, Skyline Community College, National Archives Pacific Sierra Region, regional shopping centers, and a quaint downtown district with an international flavor. The premier site among the more than 20 parks that make up the recreational network is City Park, where residents enjoy a gym, walking paths, tennis courts, swimming pool, teen center, and sports and athletic facilities. Good schools, wonderful retail opportunities, beautiful homes, and a vibrant local economy contribute to San Bruno’s desirability as residential retreat within the bustling Bay Area.

Belleair- Etc. (30-day trend)
 
Number of Properties
Avg Price
Avg $/SQFT
Avg DOM
% of Avg Sold Price/Avg List Price
Active
5 (Number of Properties)
$989,770 (Avg Price)
$738 (Avg $/SQFT)
54 (Avg DOM)
Sold
3 (Number of Properties)
$1,050,188 (Avg Price)
$839 (Avg $/SQFT)
44 (Avg DOM)
103% (% of Avg Sold Price/Avg List Price)
Crestmoor Park 1 (30-day trend)
 
Number of Properties
Avg Price
Avg $/SQFT
Avg DOM
% of Avg Sold Price/Avg List Price
Active
0 (Number of Properties)
$0 (Avg Price)
$0 (Avg $/SQFT)
0 (Avg DOM)
Sold
0 (Number of Properties)
$0 (Avg Price)
$0 (Avg $/SQFT)
0 (Avg DOM)
0% (% of Avg Sold Price/Avg List Price)
Crestmoor Park 2 (30-day trend)
 
Number of Properties
Avg Price
Avg $/SQFT
Avg DOM
% of Avg Sold Price/Avg List Price
Active
0 (Number of Properties)
$1,348,888 (Avg Price)
$956 (Avg $/SQFT)
4 (Avg DOM)
Sold
0 (Number of Properties)
$1,850,000 (Avg Price)
$840 (Avg $/SQFT)
22 (Avg DOM)
116% (% of Avg Sold Price/Avg List Price)
Crestmoor Park 3 (30-day trend)
 
Number of Properties
Avg Price
Avg $/SQFT
Avg DOM
% of Avg Sold Price/Avg List Price
Active
0 (Number of Properties)
$1,408,000 (Avg Price)
$1,083 (Avg $/SQFT)
6 (Avg DOM)
Sold
1 (Number of Properties)
$1,529,728 (Avg Price)
$1,071 (Avg $/SQFT)
36 (Avg DOM)
104% (% of Avg Sold Price/Avg List Price)
El Crystal (30-day trend)
 
Number of Properties
Avg Price
Avg $/SQFT
Avg DOM
% of Avg Sold Price/Avg List Price
Active
0 (Number of Properties)
Huntington Park (30-day trend)
 
Number of Properties
Avg Price
Avg $/SQFT
Avg DOM
% of Avg Sold Price/Avg List Price
Active
2 (Number of Properties)
$1,382,175 (Avg Price)
$1,015 (Avg $/SQFT)
38 (Avg DOM)
Sold
4 (Number of Properties)
$1,357,553 (Avg Price)
$965 (Avg $/SQFT)
59 (Avg DOM)
110% (% of Avg Sold Price/Avg List Price)
Lomita Park (30-day trend)
 
Number of Properties
Avg Price
Avg $/SQFT
Avg DOM
% of Avg Sold Price/Avg List Price
Active
0 (Number of Properties)
$1,099,000 (Avg Price)
$845 (Avg $/SQFT)
13 (Avg DOM)
Sold
1 (Number of Properties)
$1,130,000 (Avg Price)
$869 (Avg $/SQFT)
39 (Avg DOM)
103% (% of Avg Sold Price/Avg List Price)
Mills Park (30-day trend)
 
Number of Properties
Avg Price
Avg $/SQFT
Avg DOM
% of Avg Sold Price/Avg List Price
Active
0 (Number of Properties)
$0 (Avg Price)
$0 (Avg $/SQFT)
0 (Avg DOM)
Sold
0 (Number of Properties)
$1,220,589 (Avg Price)
$824 (Avg $/SQFT)
75 (Avg DOM)
94% (% of Avg Sold Price/Avg List Price)
Monte Verde (30-day trend)
 
Number of Properties
Avg Price
Avg $/SQFT
Avg DOM
% of Avg Sold Price/Avg List Price
Active
0 (Number of Properties)
$1,207,500 (Avg Price)
$812 (Avg $/SQFT)
16 (Avg DOM)
Sold
0 (Number of Properties)
$0 (Avg Price)
$0 (Avg $/SQFT)
0 (Avg DOM)
0% (% of Avg Sold Price/Avg List Price)
Pacific Heights / Sea Cliff (30-day trend)
 
Number of Properties
Avg Price
Avg $/SQFT
Avg DOM
% of Avg Sold Price/Avg List Price
Active
4 (Number of Properties)
$1,860,714 (Avg Price)
$809 (Avg $/SQFT)
20 (Avg DOM)
Sold
2 (Number of Properties)
$1,518,666 (Avg Price)
$886 (Avg $/SQFT)
62 (Avg DOM)
111% (% of Avg Sold Price/Avg List Price)
Parkview Terrace/San Bruno Heigh (30-day trend)
 
Number of Properties
Avg Price
Avg $/SQFT
Avg DOM
% of Avg Sold Price/Avg List Price
Active
0 (Number of Properties)
$1,486,190 (Avg Price)
$986 (Avg $/SQFT)
5 (Avg DOM)
Sold
1 (Number of Properties)
$2,100,441 (Avg Price)
$827 (Avg $/SQFT)
73 (Avg DOM)
103% (% of Avg Sold Price/Avg List Price)
Penninsula Place Condos Etc. (30-day trend)
 
Number of Properties
Avg Price
Avg $/SQFT
Avg DOM
% of Avg Sold Price/Avg List Price
Active
0 (Number of Properties)
$388,888 (Avg Price)
$864 (Avg $/SQFT)
71 (Avg DOM)
Sold
1 (Number of Properties)
$497,739 (Avg Price)
$841 (Avg $/SQFT)
107 (Avg DOM)
100% (% of Avg Sold Price/Avg List Price)
Portola Highlands (30-day trend)
 
Number of Properties
Avg Price
Avg $/SQFT
Avg DOM
% of Avg Sold Price/Avg List Price
Active
0 (Number of Properties)
$0 (Avg Price)
$0 (Avg $/SQFT)
0 (Avg DOM)
Sold
1 (Number of Properties)
$1,900,000 (Avg Price)
$791 (Avg $/SQFT)
36 (Avg DOM)
109% (% of Avg Sold Price/Avg List Price)
Rollingwood (30-day trend)
 
Number of Properties
Avg Price
Avg $/SQFT
Avg DOM
% of Avg Sold Price/Avg List Price
Active
0 (Number of Properties)
$1,518,606 (Avg Price)
$989 (Avg $/SQFT)
7 (Avg DOM)
Sold
1 (Number of Properties)
$1,647,790 (Avg Price)
$1,091 (Avg $/SQFT)
26 (Avg DOM)
111% (% of Avg Sold Price/Avg List Price)
San Bruno Park Etc. (30-day trend)
 
Number of Properties
Avg Price
Avg $/SQFT
Avg DOM
% of Avg Sold Price/Avg List Price
Active
1 (Number of Properties)
$997,647 (Avg Price)
$1,026 (Avg $/SQFT)
24 (Avg DOM)
Sold
1 (Number of Properties)
$1,023,283 (Avg Price)
$813 (Avg $/SQFT)
44 (Avg DOM)
101% (% of Avg Sold Price/Avg List Price)
Shelter Creek Condos (30-day trend)
 
Number of Properties
Avg Price
Avg $/SQFT
Avg DOM
% of Avg Sold Price/Avg List Price
Active
11 (Number of Properties)
$448,884 (Avg Price)
$758 (Avg $/SQFT)
60 (Avg DOM)
Sold
0 (Number of Properties)
$436,363 (Avg Price)
$640 (Avg $/SQFT)
95 (Avg DOM)
95% (% of Avg Sold Price/Avg List Price)

Property Info